Market Correction And The Current State Of Amazon
The current landscape of Amazon rounding into Q4 – cumulated with the unprecedented escalation of sales from last year and the uncertainty of next year’s trajectory – can be described as tumultuous. This has left many Amazon sellers incredibly nervous about the stability of their business, particularly those who are newer to ecommerce and who don’t understand market correction.
What is Market Correction and How Does It Apply To Amazon?
Market correction is a general term that can be summarized as the following:
“A market correction is a rapid change in the nominal price of a commodity, after a barrier to free trade has been removed and the free market establishes a new equilibrium price. It may also refer to several of these single-commodity corrections en masse, as a collective effect over several markets concurrently.”
In layman’s terms, it is a self-governing correction in the market that usually happens over time and generally occurs in the wake of economic instability, inflation, or an extreme circumstance (like COVID), affecting the demand-and-supply of certain products or services.
As this article explains, extreme market instability isn’t very common and rarely does it result in a bear market which should provide some solace to Ecommerce sellers. The problem is that it can take awhile to correct and provide equilibrium.
How patient you are and how long you actively manage the ups and downs of supply-and-demand will directly determine the success of your business. Amazon’s marketplace will always be ever-changing (regardless of environmental and economic factors), so to expect consistency in sales is a pipedream that all experienced Amazon sellers understand.
However, it’s easy to sympathize with newer Amazon sellers that are comparing this year’s overall sales trajectory with last year’s overall sales trends, leading to grave disappointment, second-guessing, and anxiety.
In this article, we will discuss facts on how Amazon and its sellers performed during the pandemic, how they are performing now, and what to expect for 2022.
The Impact of Covid On Amazon Sales in 2020
The onset of COVID-19 of last year shook the worldwide economy. However, online platforms like Amazon, Etsy, and Walmart saw a surge in sales as a result of the population turning to the internet to purchase things like perishables and essentials. Amazon.com Inc. ‘s. web-based business income saw gains of 47.0% year-over-year for the second quarter of 2020. A spike in deals from Amazon’s central internet business tasks (which incorporate online stores, outsider merchant administrations, and retail membership administrations) powered its income development in the midst of the COVID-19 through advanced promoting and actual store deals (fundamentally through the popular store chain, Whole Foods.)
Insights for Amazon Sellers During Pandemic
Amazon’s net sales from third-party sellers grew 57% year-over-year in 2020, heavily contributing to Amazon’s $386 billion annual revenue. The report explores these sellers’ diverse business strategies, including their challenges, revenue, and ecommerce growth plans for 2021 and onward.
Key insights include:
- COVID-19 contributed to Amazon sellers’ revenue in 2020.
- 51% of Amazon sellers say their sales increased during and/or because of the COVID-19 pandemic.
- 44% said their businesses have performed better than expected because of the COVID-19 pandemic.
- 85% of Amazon sellers were profitable going into 2021.
- 62% said their profits increased during 2020.
- Ecommerce expansion was a top priority for Amazon sellers in 2021.
- 96% planned to expand their Amazon businesses in 2021.
- 39% considered selling on Walmart.com in 2021, and many explored Shopify, Instagram, Target, and other platforms to increase reach and sales.
- Sellers continue to invest in Amazon — but they have concerns.
- 66% are concerned about increased competition driving prices down.
- Amazon’s ad business is booming, but it’s costing sellers; 62% are concerned about increasing ad spend on Amazon.
Increase in Profit for Amazon:
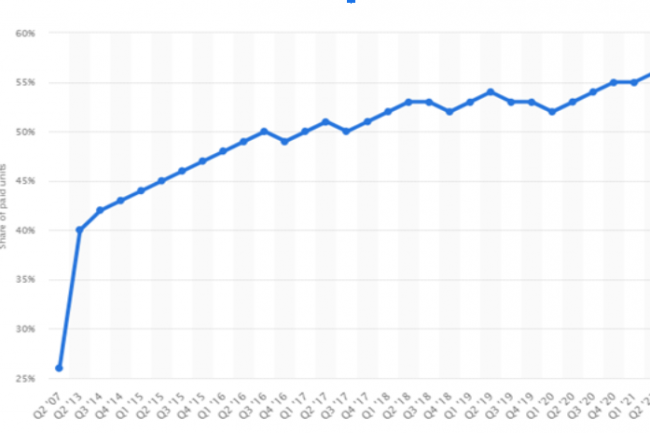
In 2020, the e-commerce giant generated approximately 80.5 billion dollars in third-party seller services – an increase of nearly 50 percent over the previous year. While these figures are the product of orders throughout the year, a significant chunk was attributable to special offers and discount days.
According to a survey, Black Friday has historically been the yearly shopping event, driving the largest sales increase for Amazon sellers (followed by Prime Day and Amazon Summer Sale). In the context of the coronavirus pandemic, Amazon Prime Day played a particularly decisive role for small and medium-sized businesses around the world, many of which had to turn to online sales overnight in order to survive.
Reported Amazon Sales Figure Comparison in 2020 and 2021 by Amazon
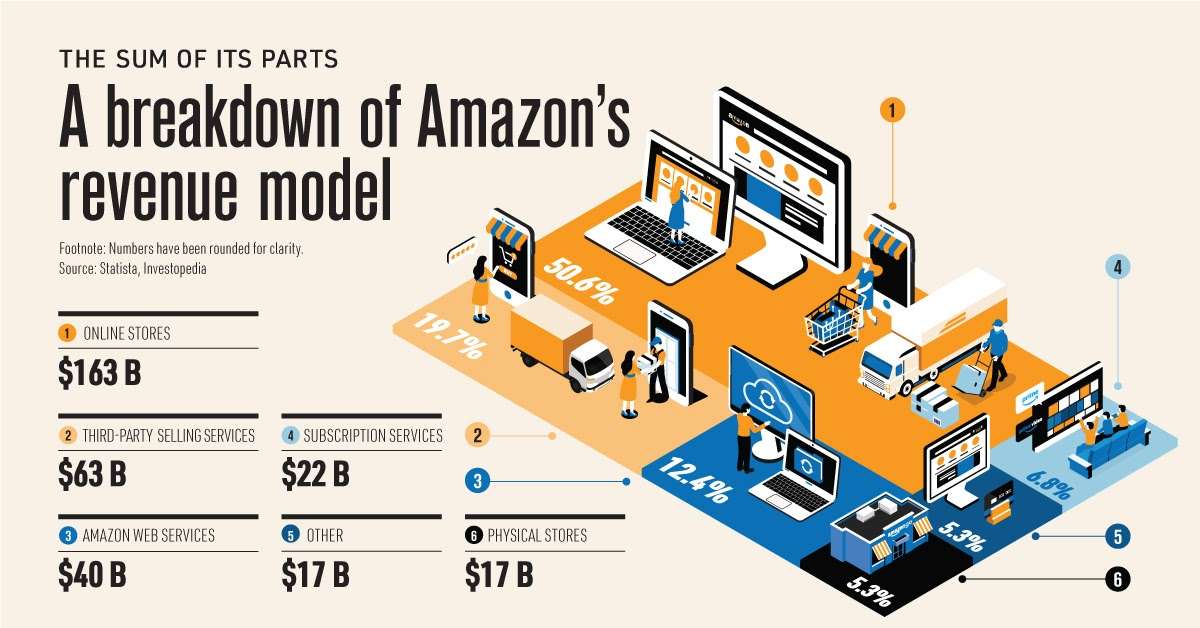
For the second quarter end of 2020
- North American net sales of $67.55 billion correlated with an increase of 21.9% from $55.44 billion in the second quarter of 2019.
- International sales (not including Amazon’s U.S. site) made $30.72 billion, a 35.5% increase from $22.67 billion a year ago.
- Worldwide revenue of $113.08 billion was an increase of 27.2% from $88.91 billion a year earlier.
- Net product sales (the value of goods Amazon sells on its own behalf like Amazon Basics) increased 15.4% (from $50.24 billion to $50 billion. Net service sales reached $55.08 billion, an 42.4% which include revenue from Amazon Web Services, Prime subscriptions and Amazon’s commission on sales by marketplace merchants and fulfillment fees charged to those merchants. Third-party seller fees alone increased 37.9% to $25.09 billion from $18.20 billion.
- Amazon Web Services revenue of $14.81 billion, up 37.0% from $10.81 billion. AWS operating income was $4.19 billion, up 24.9% from $3.36 billion.
- Other revenue, which is mainly from advertising, increased 87.5% to $7.91 billion from $4.22 billion.
- Operating income of $7.70 billion, a 33.1% increase from $5.84 billion. AWS represented 54.4% of total operating income, compared with 57.5% during the same period in 2020.
- Net income of $7.78 billion, up 48.4% from $5.24 billion.
For the second quarter end 2021:
- North American sales of $131.92 billion, an increase of 29.9% from $101.56 billion in the same period a year ago.
- International sales of $61.37 billion, up 46.9% from $41.77 billion.
- Worldwide revenue of $221.60 billion, up 34.8% from $164.36 billion a year earlier. Net product sales increased 25.4% to $115.50 billion from $92.09 billion. Net service sales reached $106.10 billion, a 46.8% increase from $72.28 billion.
- AWS sales of $28.31 billion, a 34.7% increase from $21.03 billion. AWS operating income was $8.36 billion, up 29.9% from $6.43 billion.
- Other revenue, which is mainly from advertising, increased 82.3% to $14.82 billion from $8.13 billion.
- Operating income of $16.57 billion, up 68.5% from $9.83 billion. AWS represented 50.4% of total operating income, compared with 65.4% during the same period in 2020.
- Net income of $15.89 billion, an increase of 104.2% from $7.78 billion in the same period a year ago.
While these astounding metrics speak volumes about the success of Amazon itself, they don’t necessarily translate to the experience or success of Amazon sellers from 2020 to early 2021 and moving into 2022.
Amazon Prime Day Comparison 2020 and 2021:
Prime Day in 2020
Amazon’s annual, two-day Prime Day sales event was held in October of last year after the coronavirus pandemic delayed the event for months.
Amazon doesn’t release specific revenue numbers around its Prime Day events, but the company said it sold more than 175 million items during last year’s Prime Day.
Sellers who had been experiencing unprecedented revenue in the first 2 quarters of 2020 were ambitious about what Q4 would hold, particularly with the popularity that Prime Day proved to be. Unfortunately, due to inventory restrictions and cargo delays, Q4 was to become a massive blow for many merchants who were riding on the coattails of previous months.
Prime Day in 2021
Prime Day 2021 generated solid sales growth for Amazon but had less of an impact than the 2020 event, industry observers say.
Amazon’s estimated gross merchandise sales on Prime Day – held June 21 to 22 this year – totaled $11.19 billion worldwide (up 7.6% from $10.39 billion on Oct. 13 and 14, 2020).
With expectations high, it was assumed by many Amazon Sellers that numbers for Prime Day (particularly because it was a 2-day event) would be overwhelmingly positive. But results proved to be luke-warm as a whole and even disappointing for many. This may be attributed to the fact that 2021 Prime Day came only eight months after last year’s Prime Day – a much shorter period of time than the 15 months between Prime Day 2019 and 2020. Amazon also did not add any new countries to Prime Day this year after adding two to last year’s catalog and four in the previous year.
Importance of Essential Products During the Height of COVID
As America transitioned from winter to spring of 2020, Amazon gave importance to essential goods over non-essential goods for shipments due to the surge of demand for products necessary to survive. This skyrocketed profits for those selling products like hand sanitizer, toilet paper, house cleaners, and baby diapers while the demand for non-essential items like jewelry, furniture, and workout gear either plateaued or dropped.
Meanwhile, a pause within the global supply chain led to shortages in provisions. Amazon responded by shifting gears from its role as an “omni-selling” platform to a useful chain provider, focusing all energies into helping the country readily access must-haves.
This domino effect caused even more uncertainty in the market as America (with the rest of the world) navigated a summer in isolation. While overall Amazon sales for 2020 were on track to significantly bypass the numbers from the preceding year, many Amazon sellers were dealt the harsh blow of inventory restrictions and unprecedented shipping delays that left many businesses unable to accommodate demand during the critical period of Q4.
2021 “Post” Pandemic Amazon Sales Figures
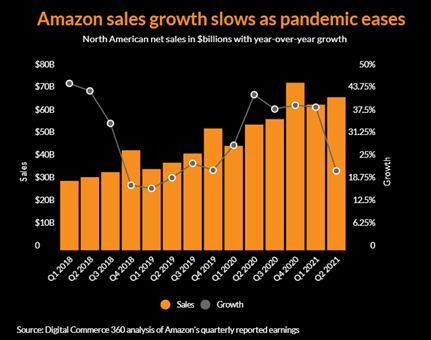
As the pandemic gradually eased in 2021 and more of the world opened up, people were not only excited to leave the house – they were excited to go back to frequenting restaurants, grocery stores, and brick and mortar business. Amazon sales started to decrease which was a harsh reality check for sellers who anticipated similar (if not higher) profit margins from the year before. We can get an idea from the following graph of how overall sales growth lowered (especially in North America).
Cause for Panic?
Obviously, there is a lot to unpack when presented with all of these numbers. The natural progression of online consumerism coupled with a worldwide pandemic and a growing number of Amazon sellers (think: competitors) has led to a lot of unknowns regarding the future for many Amazon-reliant retailers.
At the same time, the influx of sellers to the Walmart marketplace has seemed to invigorate Amazon sales as the two massive marketplaces find a way to compete and energize each other’s ecosystem.
With a new surge of COVID-virus mutations, it is uncertain what 2021 Q4 and 2022 Q1 will bring. Many Amazon sellers are optimistic about what the future holds while others are diffident or downright fearful.
This is a natural reaction for business owners – particularly, those that are fairly new to the Amazon hustle. But veteran sellers understand market correction and how short-term changes don’t necessarily reflect long-term valuations. While the last few years have undoubtedly proven to disrupt projected market trends, it’s important to find solitude in the reality that most markets self-correct. Supply-chain logistics WILL work itself out and consumer demands WILL become balanced as humans continue to habituate to the changing economic and social climate.
In effect, it’s an example of Darwinism at its finest.
sources:
https://www.digitalcommerce360.com/article/amazon-sales/?fbclid=IwAR1Fb1Bj0MgQGjjWb7G6p20O2rvJQFGGByeE41bvKD9mZVR9cwvgQffQrgM
https://www.schwab.com/learn/story/market-corrections-are-more-common-than-you-think
https://variety.com/2021/digital/news/amazon-q2-2021-earnings-1235030763/?fbclid=IwAR09WO63Z0694TU74AaGZMYkobrE5PwFduD3nZ6NbV3fsbmq7x5egVz_uFY
https://www.statista.com/statistics/259782/third-party-seller-share-of-amazon-platform/?
https://www.businessinsider.com/amazon-pulls-in-thousands-new-independent-sellers-a-day-2021-3?fbclid=IwAR3lFlNea8N75oVhqJL0c6fwpJf2zfA3VQqCthuncqsGWucl22gmjzeFJM4
https://www.statista.com/statistics/259782/third-party-seller-share-of-amazon-platform/#:~:text=Amazon%20seller%20revenues&text=In%202020%2C%20the%20e%2Dcommerce,percent%20over%20the%20previous%20year.
https://www.junglescout.com/amazon-seller-report/
https://www.ascentialedge.com/insights/ecommerce-blog/amazon/how-has-covid-19-impacted-amazon
https://www.daytradetheworld.com/trading-blog/how-to-know-when-a-correction-in-the-market-is-approaching/
https://www.smartinsights.com/digital-marketing-strategy/online-business-revenue-models/amazon-case-study/


